In general, ocean currents are considered uniform and horizontally homogeneous movements of seawater. However, as you get smaller in scale, you realize that they are highly heterogeneous and full of uncertainties that are yet to be studied, such as the vertical transfer of nutrients and the mixing of carbon into the deep ocean.
Why is it so important to study these processes? Because, among other reasons, they have a direct impact on climate change. And why, then, is it so difficult? Essentially, because direct sampling is really very difficult to achieve.
This is exactly where high performance computing comes in, by making it possible to unveil these (and so many other) ocean processes through high-resolution numerical models, resulting, for example, in three-dimensional models, such as those being developed in Portugal.
Researchers from the Instituto Superior Técnico and CERENA (Center of Natural Resources and Ambient), together with researchers from the UTAustin, developed novel methods to predict the spatial distribution of temperature and salinity in the oceans through data modeling of the reflection of acoustic waves on the seawater – the seismic oceanography.
Predicting these oceanic spatial properties and their uncertainty from the seismic oceanography data often required solving a highly nonlinear inversion problem, which frequently demands using HPC systems.
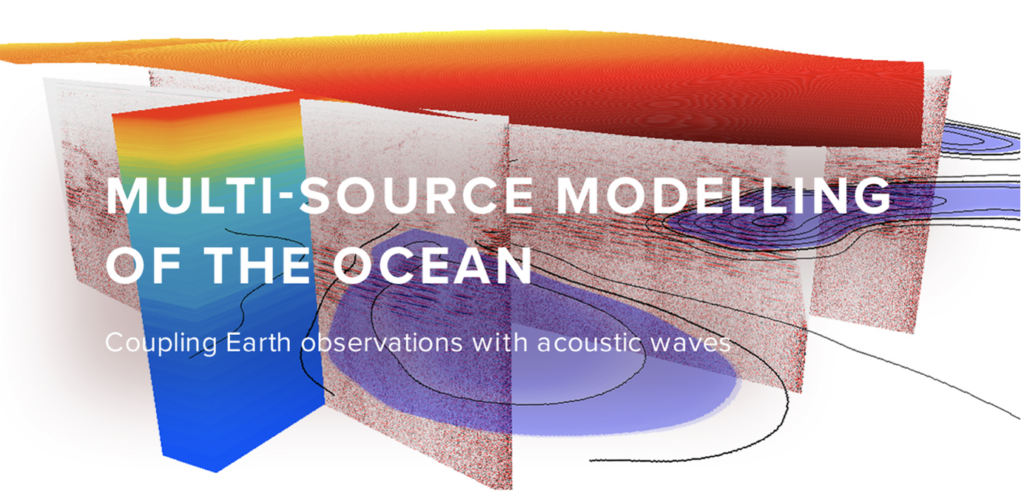
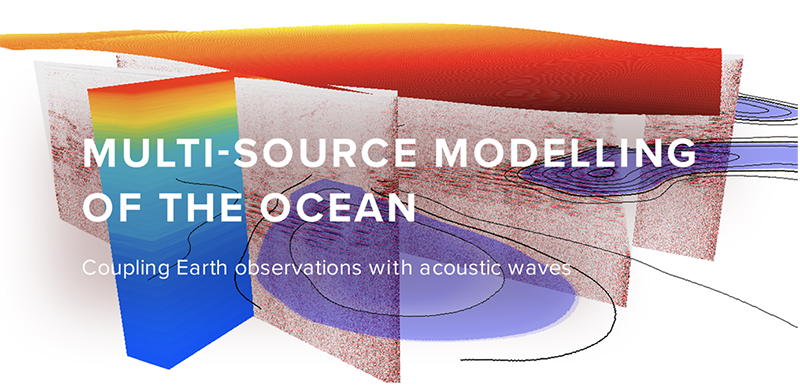
In the context of the probing project “Multi-source modeling of the ocean: coupling Earth observations with acoustic waves,” supported by the program UTAustin|Portugal, the methods developed by the partnership have been using HPC resources from the Texas Advanced Computing Center to obtain temperature and salinity models from the Planície Abissal da Madeira (Portugal).
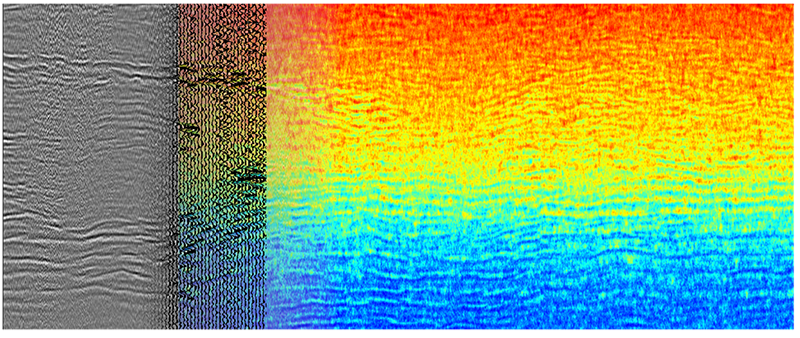
The picture below shows one example of a preliminary result. The left side shows the original seismic oceanography data before inversion; the right side, the solution to the inversion problem, displays the ocean spatial temperature distribution through a two-dimensional vertical section with metric spatial scale.